With the new changes in Analytics, we have some exciting new features available. One of the more exciting changes is the ability to share dashboards and custom reports. If you don’t know what dashboards are, then take a look at this post by SEObook that explains how to set up actionable SEO dashboards. You can use dashboards for a quick overview of what’s important on your site – from conversions to organic search quality, visitor behavior, paid ad performance, and much more. They give you a quick view of what’s important, and allow you to link to custom reports to further drill-down into the data.
Since the above post by SEO Book didn’t include any shared links, I figured I’d create the dashboards they described and share them with you. Below you’ll find links to share the dashboards I created. Of course, you’ll need to modify some of the widgets to reflect your specific needs.
Geographic location: This dashboard shows you a quick overview of where your visitors are coming from, broken down by language, city, and country.

https://www.google.com/analytics/web/permalink?type=dashboard&uid=v_kkwdN-QMeW85_UphxTJA
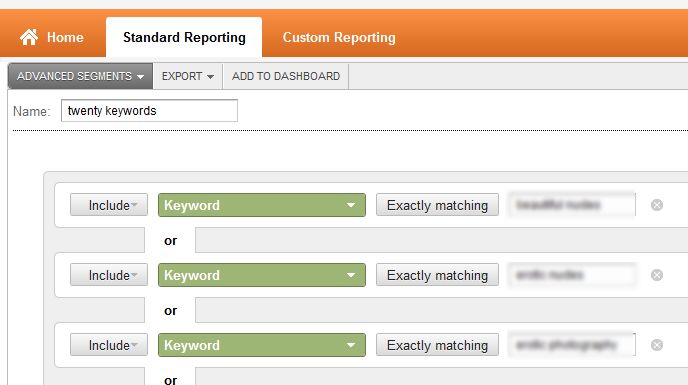
SEO monitoring: This great dashboard shows how well your site is performing in organic search. It covers focuses heavily on non-branded search terms, which are a great indicator of your site visibility. To use this, you must change the keywords to match your brand name, and any variations.

https://www.google.com/analytics/web/permalink?type=dashboard&uid=qBF59OdCT26RW9DtjiPbpg
Site conversions: Use this dashboard to understand where your site conversions are coming from. You should change it to include any particular conversions for your site. I have included cart, checkout, and receipt conversions for mine, but you may have different conversions you want to monitor.

https://www.google.com/analytics/web/permalink?type=dashboard&uid=GBwgkSmJRlChe5vNUnLv0w
Site usage/quality: Use this dashboard to monitor how well your site performs across a variety of dimensions – from browser’s with high bounce rates (indicator of rendering problems) to which landing pages perform the best. You can also view the top pages that visitors hit, and which pages they exit on the most.

https://www.google.com/analytics/web/permalink?type=dashboard&uid=AqHbBjFXQbCFJNdMhLhoEw
Visitor behavior: You should always think about three things when looking at your site stats – acquisition, behavior, and engagement. This dashboard presents a view of frequency and recency of visits, along with their associated conversion rates. It also gives you some basic metrics like bounce rates and new vs. returning visitors.

https://www.google.com/analytics/web/permalink?type=dashboard&uid=vd95z-_9Slm-YHqbv2rNqA
Linking custom reports to your dashboards
If you haven’t used custom reports before, then read this article which explains their purpose. Basically, they allow you to focus on specific metrics and dimensions that you normally might drill-down to find.
One advantage to them is that you can link a custom report to your dashboard widgets. So if you want to see more data on keywords that convert, or your browser quality on the site, you can. In the above “site usage quality” dashboard, you can see there’s a widget that shows browser quality. What if you want to see more data about this? You can edit the widget and insert a custom report link in the “Link to custom report” field.
In the screenshot below, you can see how you are able to select a custom report to attach to the widget.

So what other ways are you using the Google Analytics dashboards? With the new sharing feature, I’m excited to see what else people are doing. The creative angles are almost limitless, and I’m sure people are putting together some great dashboards. Share your thoughts and links to yours!
May update: Additional dashboards
I’m always creating new dashboards, saving new ones I find, and modifying existing ones. Below you can find some others that I have set up.
Revenue dashboard – One of my favorites, and shows ecommerce data along with the various sources that sent conversions, from organic to referrals, and branded/non-branded keywords
Mobile eCommerce dashboard – With mobile commerce gaining traction, this one might be useful going forward.
Social media dashboard – Google introduced a host of new social media metrics and dimensions, and this dashboard helps you understand the quality of traffic coming from social sites.
Weekly site review – This shows a simple overview of basic site metrics like total visits, bounce rate, goal conversions by source, and revenue.